node在osx開發環境設置: 一次釐清brew,nvm, npm,node

如同在設置python的開發環境一樣,需要先想好版本控制的流程,讓自己可以在不同版本間切換,在node相關的開發更是需要小心翼翼,因為那是一個非常快速迭代,和擁有各式各樣依賴的開發社群。

在osx下,還是偏向以brew作為全局套件的最高層版本控制。在node和npm不同版本間的控制,則使用nvm,而在單一個項目下的第三方js套件,則可以使用npm來做安裝。


brew node development.001

第一步:用brew安裝nvm

# 直接安裝最新版nvm
brew install nvm

第二步: 設定shell的configuration檔案(/etc/profile, ~/.bash_profile)

export NVM_DIR="$HOME/.nvm"
. "/usr/local/opt/nvm/nvm.sh"

第三步:用nvm安裝node

nvm install node

第四步:在專案的資料夾中放.nvmrc設置檔

node -v > .nvmrc

閱讀參考
Node.js安裝和版本切換教學
使用nvm管理不同版本的npm/node
nvmrc範例
nvm v.s npm

書籍閱讀:The Visual Display of Quantitative Information

圖片搜尋結果
這本書The Visual Display of Quantitative Information是耶魯大學統計學家艾德華。塔夫特(Edward Tufte)的經典著作,談論視覺化如何呈現量化資訊(就是資料視覺化),他被稱作現代視覺化大師,整本書很樸素簡單,提供非常大量的精美圖片,來呈現資訊視覺化的方方面面概念,書的寫作邏輯有點特別,需要稍微適應一下。

本書主要分成兩大部分:

1. Graphical Practice
– Graphical Excellence
– Graphical Integrity
– Souces of Graphical Integrity and Sophistication
2. Thoery of Data Graphics
– Data-Ink and Graphical Redesign
– Chartjunk: Vibrations, Grids, and Ducks
– Multifunctioning Graphical Design
– High-Resolution Data Graphics
– Aesthetics and Technique in Data Graphical Design

什麼是好的視覺化(Graphical Excellence)

好的視覺圖表可以展現複雜的想法,將其表達的清楚(clarity)、精準(precision)和有效(efficiency):

1. 呈現資料(show data)
2. 讓觀看者去思考圖表呈現的概念,而非背後的方法
3. 利用有限的空間呈現量化數字
4. 鼓勵用視覺去比較資料
5. 展現資料在不同層次上的細節,從概觀到細部樣貌
6. 具有明確的目的:描述、探索、格式化、裝飾
7. 可以用來結合統計和資料描述

Principles of Graphical Excellence
這張的最後,用什麼定義一個良好的視覺化作結,關鍵就是視覺化的效果能表達清楚資料背後的想法。

Graphical excellence is the well-designed presentation of interesting data-a matter of substance, of statistics, and of design.

Graphical excellence consists of complex ideas communicated with clarity, precision, and efficiency.

Graphical excellence is that which gives to the viewer the greatest number of ideas in the shortest time with the least ink in the smallest space.

Graphical excellence is nearly always multivariate.
And graphical excellence requires telling the truth about the data

視覺化要有誠信Graphical Integrity

這章要談的就是如何讓資料視覺化能“實話實說”,而非玩弄是非。

第一個概念就是:

The number of information-carring dimensions depicted should not exceed the number of dimensions in the data.

這張開頭使用了許多“錯誤”的資料視覺化例子,往往過度華麗資料本身,因此造成視覺化的誤差,這往往就是用了超過資料本身的“維度”來表現資料特性。

第二個概念就是:

Graphics must not quote data out of context, which mean context is essential for graphical integrity.

可以把“要跟誰比”這個想法放在心上,讓資料有足夠的對照組,提供更好的脈絡。

The representation of numbers, as physically measured on the surface of the graphic itself, should be directly proportional to the numerical quantities represented.

Clear, detailed, and thorough labeling should be used to defeat graphical distortion and ambiguity. Write out explanations of the data on the graphic itself. Label important events in the data.

Show data variation, not design variation. #這句講得超好,很容易犯的錯誤

The number of information-carrying dimensions depicted should not exceed the number of dimensions in the data.

Graphics must not quote data out of context.

Data-Ink and Graphical Redesign

Occasionally artfulness of design makes a graphic worthy of the Museum of Modern Art, but essentially statistical graphics are instruments to help people reason about quantitative information

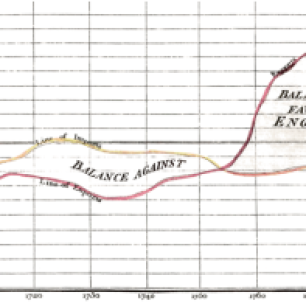
這章開始直指資料視覺化的想法,一開始提到William Playfair這位200多年前的蘇格蘭工程師,所繪製的圖表,左邊是其在1785年,右邊是相隔一年後的風格改進,會發現這樣的改善,很大程度提升直觀性,原因在於其減少了跟資料無關的素材,這邊作者提出的一個核心原則


Above all else show the data.

一張圖表中,決大部分的"墨水"要跟想呈現的資料相關聯,就是所謂的Data-Ink(non-erasable core of a graphic, the non-redundant ink arranged in response to variation in the numbers represented)。

Data-ink ratio = data-ink / total ink used to print the graphic

這邊作者提出一個公式:Data-ink ratio,用來評估一張圖表是否切合這邊提出的原則,盡量減少非資料相關的"墨水",最大化Data-ink ratio

除了最大化Data-ink的比例,再來則是去除非Data-ink的部分,下面這張圖表做了很好的示範

螢幕快照 2018-02-14 下午10.01.36.png

左邊是原始的圖表,而右邊則是non-data ink + data ink的分圖,會發現最右邊只剩下data-ink的圖表,相對於原始圖表更加的清晰明白。

Erase non-data-ink and erase redundant data-ink.

去除圖表中的三個常見多餘:Moiré vibration, Grid 和 Duck

螢幕快照 2018-02-19 下午11.54.54

曾經有段時間蠻流行有上面這種填充方式來呈現黑白圖表中的不同資訊,這類黑白型態所形塑的分塊,作者moire vibration來暱稱,直指是擾亂視聽,沒有太多用處的裝飾。

螢幕快照 2018-02-19 下午11.51.59

另外一個就是把隔線(Grid)簡化,藉由合併去除,或是用淡色來取代,可以很大程度提高簡潔感。


延伸閱讀
史上最傑出的繪圖大師
讀後總結:The Visual Display of Quantitative Information
知乎討論串
豆瓣書單

使用zapier將evernote筆記自動發布到wordpress部落格上

目前應用程式玲琅滿目,此時有一個方便的方式串連起來兩個應用程式,可以省去許多時間,比如我常用evernote來收集資料,有時候是直接在evernote上整理部落格文章需要的資料和圖片,因為相對於evernote編寫環境穩定,wordpress 網頁版操作感亟待提升,也不好管理的文章,此時就需要在evernote上編寫文章,然後發布到wordpress上的自動化流程。

Zapier就能很好的提供這個需求,跟IFTTT功能類似(用起來比IFTTT順暢許多),裡面有各式各樣串連兩個應用程式的自動化服務,非常棒!


裡面的串接邏輯很簡單, A應用程式做了一件事後(Action),會觸發B應用程式,所以在我evernote的使用場景中,當我在特定筆記本儲存篇新的筆記,便會把這篇evernote,轉貼到wordpress上,而zapier可以提供我去調整evernote文章上的資訊,如何貼到wordpress上,評律大概15分鐘一次。

螢幕快照 2018-01-09 下午5.24.57

研究科學家背景:Winston Hide

最近在整理堆積如山的待閱讀論文,其中看到這邊撰寫於2010年的文章Gene-Expression Ontologies and Tag-Based Expression Profiling,通訊作者是Winston Hide教授,主要是探討CAGE資料的分析方式,因之前項目需求,稍微知道目前FANTOM計畫中,主要使用的技術便是根基於CAGE而來,因而產生興趣。

winstonhide

Winston Hide教授是學分子生物學出身,目前是計算生物學教授,參與英國的The 100,000 Genomes Project,本身有個部落格Element of Impact,最後一次更新是在2015年,他的學經歷非常豐富,也跑去在美國矽谷的超級電腦公司MasPar(已倒)工作過,學術經歷則橫跨美國、南非(在南非時參與pan-african genomic project)再到英國University of Sheffield任職神經科學轉譯醫學研究部門的負責人。

他的研究方式通常都會從調控的角度著手,使用整合性分析的方式(偏生物資訊手法),也會開發生物資訊的工具如CAGExploreR。

E. Dimont, O. Hofmann, S. J. Ho Sui, A. R. R. Forrest, H. Kawaji, the FANTOM Consortium, and W. Hide, “CAGExploreR: an R package for the analysis and visualization of promoter dynamics across multiple experiments.” Bioinformatics, Mar. 2014.

這篇的軟體已經沒有在維護惹,在Oxford雜誌上面的圖也看不太到,有點可惜!

FANTOM Consortium and the RIKEN PMI and CLST (DGT), “A promoter-level mammalian expression atlas.,” Nature, vol. 507, no. 7493, pp. 462–470, Mar. 2014.
K. L. Kathrein, A. Barton, Z. Gitlin, Y.-H. Huang, T. P. Ward, O. Hofmann, A. DiBiase, A. Song, W. Hide, Y. Zhou, and L. I. Zon, “A network of epigenetic regulators guides developmental haematopoiesis in vivo.,” Nature Cell Biology, vol. 15, no. 12, pp. 1516–1525, Dec. 2013.

假如對於基因調控機制的研究有興趣,那麼一定要關注FANTOM計畫相關的論文

C. J. Sandberg, G. Altschuler, J. Jeong, K. K. Strømme, B. Stangeland, W. Murrell, U.-H. Grasmo-Wendler, O. Myklebost, E. Helseth, E. O. Vik-Mo, W. Hide, and I. A. Langmoen, “Comparison of glioma stem cells to neural stem cells from the adult human brain identifies dysregulated Wnt- signaling and a fingerprint associated with clinical outcome,” Exp Cell Res, vol. 319, no. 14, pp. 2230–2243, Aug. 2013.

G. M. Altschuler, O. Hofmann, I. Kalatskaya, S. J. Ho Sui, A. V. Krivtsov, S. A. Armstrong, L. Stein, and W. A. Hide, “Pathprinting: An integrative approach to understand the functional basis of disease.” Genome Medicine, vol. 5, no. 7, p. 68, Jul. 2013.
pathprinting分析架構圖
很經典的手法,他把GSEA的觀念放入pathway分析中,將一個個pathway作為單位來看有無顯著,蠻有創意的方法,期待後續的發展。

N. Tiffin, E. Adie, F. Turner, H. G. Brunner, M. A. van Driel, M. Oti, N. Lopez-Bigas, C. Ouzounis, C. Perez-Iratxeta, M. A. Andrade-Navarro, A. Adeyemo, M. E. Patti, C. A. M. Semple, and W. Hide, “Computational disease gene identification: a concert of methods prioritizes type 2 diabetes and obesity candidate genes.” Nucleic Acids Res, vol. 34, no. 10, pp. 3067–3081, 2006.

使用purrr package學functional programming的觀念(六):vector transformation

在使用purrr的時候,會把要計算或是處理的資料以list或是vector的型式導入,通常都會是較複雜的nested資料結構,此時為了方便ETL,需要在pipeline中去調整資料結構,此時就會用到purrr這類vector transformation的函數,主要有七大類:

函數名稱 功能
accumulate, accumulate_right accumulate recursive folds across a list
cross, cross2, cross3, cross_df produce all combinations of list elements
flatten, flatten_lgl,flatten_int,flatten_dbl, flatten_chr, flatten_dfr, flatten_dfc Flatten a list of lists into a simple vector
list_modify, list_update modify a list
reduce, reduce_right, reduce2, reduce2_right reduce a list to a single value by iteratively applying a binary function
splice splice objects and lists of objects into a list
transpose transpose a list

這七大類中,在做資料ETL時,flatten系列、reduce系列、list_modift系列(這次整理時才發現新增的,應該會很好用)、splice和transpose的使用率會比較高,在做一些統計運算時,cross系列和accumulate系列則會幫助頗多!

論文閱讀:多層網絡(multilayer networks)(一)

在做生物網絡分析遇到問題,其中一個是當牽涉到的基因數量一多和參與的節點種類大於一種,很難用簡單的網絡(simple network)來理解,如何有效地把生物網絡更好地去分析,目前感覺採用multilater network的架構,也許是一個可以執得嘗試的方向,這部分的理論架構根據所查的文獻,還是片蠻新的領域,通常物理學、數學、社會科學領域的論文在討論這塊,這邊找到一篇專門在談multilayer network的文章,來閱讀一番。

Mikko Kivelä Alex Arenas Marc Barthelemy James P. Gleeson Yamir Moreno Mason A. Porter. Multilayer networks. Journal of Complex Networks, Volume 2, Issue 3, 1 September 2014, Pages 203–271

這篇文章提出一套架構,來整理目前討論複雜網絡(complex network)的說法:

網絡種類 Aligned Disj Eq.Size Diag L coup Cat |L| d
Multilayer network
Multivariate network
Multiplex network
Multirelational network
Multidimensional network
Multislice network
Hypernetwork
Multiweighted graph
Interconnected networks
Network of networks
Meta-matrix/meta-network


git subtree:將subfolder作為github pages site

用github pages的服務可以很輕便地將自己的html/css/js運行起來,不避自己搞定server site的架構,但所用的框架中,index.html不一定就在專案資料夾的最外層,此時就可以使用git subtree push的方式將subfolder推倒branch中作為github pages sites。

git subtree push --prefix build origin gh-pages

p.s 感覺這類用法比較非典型,先暫時頂一下需求,官方說這函數已經要被git submodule給取代惹!

參考閱讀:
Github pages
Deploying a subfolder to GitHub Pages
Deploy a subfolder as a GitHub pages site
神奇的 Git Subtree
Git SubTree 共編 Library

2017年小總結

時間咻咻地飛,一年過去惹,2017年過的也是起起伏伏,充滿許多的挑戰和困難!

今年因在DNArails的實習機會,多接觸和處理了許多藥物基因體和臨床試驗的資料庫,也認識一群很努力打拼的朋友,而研究所的專題則經歷了所謂“一個月計算量的挑戰”,深刻地體驗各種叢集電腦HPC運行任務時的坑、優化計算的方法(多線程、多進程),在碩班研究題目收尾了一套多組學的network analysis,同時,參加資料英雄2017年,一群夥伴設計了一套高風險家庭的量化系統,成功地投稿到useR2017,年尾,碩論投稿老闆的基因體與遺傳學會幸運地得了獎,過程當然許多風波,希望明年能繼續成長!