書籍閱讀:Envisioning Information

envisioning-information

這本Envisioning Information是Edward R. Tufte所撰寫的,相對於其前一本著作The Visual Display of Quantitative Information,提供的觀點是更加進階,針對於如何面對高維度的資料量。

這本書的大綱為
1. Escaping Flatland
2. Micro/Macrio Readings
3. Layering and Separation
4. Small Multiples
5. Color and Information
6. Narratives of Space and Time

如同Edard R. Tufte的風格,這本書不是個視覺化指引手冊,而是在探討觀念。

第一章 Escaping Flatland

escaping_flatland_one

上面這張日本古地圖,開啟這本書,巧妙地利用立體的畫法,結合標籤,和右邊扁平鐵路圖,清楚說明了這本書想要觀察的視覺化問題:複雜資料的視覺化。

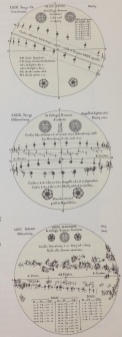
從人類開始有望眼鏡觀察日蝕後,開始能記錄這件事情,作者用一系列圖表的變化,來展現複雜數據視覺化的觀念。從左上角,單純地描繪日蝕所在的位置,再到連續很多張圖代表時間,用拋物線代表日昇月落的時間軸來放置圖表,在下一張把所有日蝕放在同一個圈中,再來抽掉圓形,只看每個日蝕位點變化隨者時間的變化,形成著名的蝴蝶圖,最後進化成近代的圖表集大成。

(micro/macro=>small multiples=>layering and separation=>……)

醫病共享決策Shared Decision Making,SDM

臨床共享決策SDM是最近台灣衛福部大力推動的,其精神旨在推動以病人為中心的醫療照護,將病人及其家屬納為醫療團隊的一份子,協助病人考量到醫療外的需求,促進醫病、醫護之間的溝通,關鍵在使用互動性的工具作為協助。
螢幕快照 2018-03-28 上午9.59.45


臨床上醫護團隊與病人的互動大致都是循者一下的流程:疾病診斷、輔導面對病情,指引醫療決策、EBM呈現、建立個人/家庭需求、醫病團隊溝通、達成醫療決策,進行治療。而SDM便是奠基於這流程下,加強醫療團隊與病人共同互動的程度。

SDM的概念起源于1982年美國以病人為照護中心的福祉計畫,在1997年由Charles提出操作型定義,至少要有醫師和病人雙方共同參與,醫師提出各種不同處置之實證資料,病人則提出個人的喜好與價值觀,彼此交換資訊討論,共同達成最佳可行之治療選項。

而為了實踐醫病共享決策的目的,就必須建立在有更好的工具,以下是SDM工具所具有的特性:
1. 互動式
2. 圖形化說明
3. 結構化問題
4. 病人可自行使用
5. 總結病患問題
6. 自動更新EBM
7. 提供充足時間

當然不是所有的臨床場景都適合使用這類醫病共享決策,常見的臨床場景是具有重大醫療不確定性、尚無明確之實證醫療證據、高風險嚴重疾病、需長期服用的藥物、具有重大身心功能、形象改變或併發症的手術診斷與治療方式。

下面有一些不錯的國際案例,可以觀察他的介面設計以及如何改善問券乏味的方式:


加拿大Ottaw Hospital
螢幕快照 2018-03-28 上午10.05.04

英國NIH Magic Project


英國Option Grid

螢幕快照 2018-03-28 上午10.11.52

英國NICE
螢幕快照 2018-03-28 上午10.02.08

美國梅約診所Mayo Clinic
糖尿病


Medscape One-On-One系列:Eric Topol訪問矽谷頂級創投Khosla資本創始人Vinod Khosla

螢幕快照 2018-03-27 下午4.21.15

Vinod Khosla是知名企業昇陽電腦的創辦人,目前是頂級矽谷創投創始人Khosla Venture,想更深入了解他,可以看這其在史丹佛商學院的訪問影片。

這部訪談的重點是想要深入理解Khosla在其創投所提出的未來商業白皮書(寫得很棒的白皮書,描繪對於醫療未來的看法)中所描繪的:百分之八十的醫師將在未來被取代。

第一點,當前醫師花太少時間在病人身上,這在未來會有所改變

My view is that doctors should be involved in the most human elements of care. A very large percentage of what doctors do can be done with technology, which would free the doctor to do other things. No doctor spends enough time with the typical patient

第二點,在科技進步的當下,連汽車上面的感測器都比人類現在在醫療場域中被監測的還多太多,這絕對代表很大的改善空間。

One other fundamental thing is that medicine almost always has been based on symptoms. I feel something, I report that, then you doctors go on a detective chase and you mostly come up with the right answers. This pains me. There are, perhaps, a few hundred sensors in the typical car and none in the body. A single ad shown to you on Facebook has way more computing power applied to it than a $10,000 medical decision you have to make. It blows my mind.

第三點,各領域的破壞創新都不是來自於原本領域的佼佼者,醫療領域沒有理由是例外。(可能暗示者改變醫療可能並不是從醫院裡面開始),從第三世界醫療缺乏處或是其他角色。

No large change comes from an organization that is at the center of the system, for two reasons: First, they tend to think linearly; and second, they really don’t have an incentive to cause disruption because “disruption" sounds like a great word but it is painful for some people. If you have been disrupted, it is not fun.

Walmart didn’t change retail; Amazon did and it made it pretty damn uncomfortable for all other retailers. Boeing and Lockheed didn’t change space; SpaceX did. General Motors and Volkswagen didn’t change electric cars or self-driving cars; it was Waymo and Tesla. NBC and CBS didn’t change media; it was Twitter, Facebook, and YouTube. I am hard-pressed to find one large change that came from an institutional source in that area. If you do find one, tell me.

Why should healthcare be different?

第四點,未來的細節是無法預測的,但是方向是可以的

One of the things about large change is that it is very hard to predict. I was directionally right but really embarrassingly wrong on the specifics. I suspect that I will be the same with healthcare.


美國推動基因體學研究至大眾健康的重要組織:Office of Public Health Genomics, OPHG

美國在推進人類基因體學計畫時,就在思考這些基因研究如何應用到大眾健康上,於是在1997年成立美國國家大眾健康基因體辦公室(Office of Public Health Genomic, OPHG),為美國國家疾病管制局其下的分支,其負責人為Muin J. Khoury, MD, PhD

identifying, evaluating, and implementing evidence-based genomics practices to prevent and control the country’s leading chronic, infectious, environmental, and occupational diseases

以上為此機構成立的目的,利用基因體知識,發展具有證據的公共衛生實踐策略。從時間軸上,OPHG分階段地來努力發展一套嚴謹可用的方式來使用基因資訊提升大眾健康:
ACCE_wheel_sm
2000-2004年,OPHG先推動ACCE Project,為了先產生一套框架,來評估基因檢測項目,主要有三要點:Analytic validity, Clinical validity, Clinical Utility。由此提出44個問題來思考單一疾病在做基因檢測時候的效益。在這階段主要是針對單一疾病,來評估基因檢測對其臨床上的幫助。
2005-20014年,OPHG緊接者ACCE Project完成了粗步針對單一疾病的評估架構,因而開啟Evaluation of Genomic Applications in Practice and Prevention,EGAPP計畫,此計畫便是落實ACCE提出的模型,實際使用其模型來對於當時的基因體研究結果做評估。

在EGAPP發表的一篇總結性質的論文:The EGAPP initiative:lessons learned 裡面算是覆盤了8年多推動系統性評估基因技術在第一線醫學使用的心得,其中一個最重要的便是闡述基因體研究和臨床研究最大的差異,便是在於跟“臨床結果”串連的程度,大多數基因體研究通常都沒有做到這一步,造成系統性評估時,常常會提供不了臨床等級的證據,或是結論使用不到實際臨床場域中。(相信這隨者時間一定會改善的)

從這篇OPHG負責人Muin J Khoury 2017年發表在JAMA上面的文章:No Shortcuts on the Long Road to Evidence-Based Genomic Medicine. 可以看出要將基因資料應用在臨床醫學上是如此漫長之路。

下面是從Textbook of Family Medicine, 9th 第43章節錄出來的,可以看出EGAPP的建議大多為“負”建議的。

螢幕快照 2018-03-26 下午10.28.11

在2017年這篇From public health genomics to precision public health:a 20-year journey文章,裡面有更近一步提到CDC在2017年八月發表的簡易horizon-scanning methods:(主要為2014年這篇Prioritizing Genomic Applications for Action by Level of Evidence: A Horizon‐Scanning Method

Tier Evidence for recommendation Example
Tier 1 Supported by a base of synthesized evidence for implementation in practice HBOC, Lynch syndrome, newborn screen, FH
Tier 2 Synthesized evidence is insufficient to support routine implementation in practice; may provide information for informed decision making Many pharmacogenomics test
Tier 3 Evidence-based recommendation against use; or irrelevant synthesized evidence identified; not ready for routine implementation in practice Direct-to-consumer personal genetics test

看到這邊會小震撼一下,至少目前DTC產品在FDA的眼光中還不成熟於在臨床中日常使用,這邊可以連結到目前CDC Public Health Genomic資料庫中各Tier裡的資訊

閱讀參考:
The EGAPP initiative: lessons learned. (2014). Genetics in Medicine
From public health genomics to precision public health: a 20-year journey. (2017). Genetic in MedicineFrom public health genomics to precision public health: a 20-year journey. (2017). Genetic in Medicine

Human Genome Epidemiology, 2nd edition.

網站:
CDC Public Health Genomic
ACCE
EGAPP

使用D3.js做複雜資料視覺化(三):理解transition的控制來設計動畫效果

在DOM中,同一個物件在轉換不同css特性時,可以藉由transition來做兩個css特性間轉換的銜接,因此創造出動畫的效果,而d3.js建立在這上面,使用d3.transition的方法來實作動畫特性,d3.transition的設計邏輯是由d3.selection所延伸而來,比較關鍵的不同是transition特性創造出的動畫效果,會有執行時間,也就是衍生了life cycle的問題。

雖然動畫效果在做資料視覺化設計中可能是需要放到最最最後的一個區塊,當然其在某些情況下會有很重要的角色(比如visualization algorithm等),可以藉由下面這個case來理解transition的life cycle特性

下面是stackoverflow上面的苦主問題
How can I make the animation of a circle continous with hovering like this gif in d3.js?

stackoverflowgif

簡單來說,提問者希望可以創造出慢慢往外擴散的圓環,這樣的效果可以利用d3.transition來達到,這樣的效果可以同時有很多方式可以達到,假如使用d3.transition的life cycle,則可以比較單純的完成。

想要更近一步理解d3.transition的話,可以閱讀下面這兩篇文章:

1. Working With Transition
2. A Life of Transition

這邊是原本提問者的代碼:

 var width = document.getElementById('circles').offsetWidth-70;
  var height =(width/2)+100;
  var scale = d3.scale.linear()
    .range(["yellow","orange","red"])
    .domain([0,60]);

  var data = [0,10,20,30,40,50,60];

  var svg = d3.select("#circles").append("svg")
      .attr("width", width+"px")
      .attr("height", height+"px");

  //circle orange
  svg.append("circle")
  .attr("cx",80)
  .attr("cy",80)
  .attr("r",30)
   .attr("fill","orange")
  .style("stroke-width","1")
  .style("stroke","orange")
  .on('mouseover', function(){
    d3.select(this).transition().ease("bounce").duration(500).attr("r",32)
  })
  .on('mouseout', function(){
    d3.select(this).transition().ease("bounce").duration(500).attr("r",30)
  })

  //circle yellow
   svg.append("circle")
  .attr("cx",80)
  .attr("cy",80)
  .attr("r",22)
  .attr("fill","yellow")
  .style("stroke-width","1")
  .style("stroke","yellow")
  .style("opacity","0.9")    

  .on('mouseover', function(){
    d3.select(this).transition().ease("bounce").duration(500).attr("r",24).style("opacity","1")
  })
  .on('mouseout', function(){
    d3.select(this).transition().ease("bounce").duration(500).attr("r",22).style("opacity","0.9")
  })      

     var circles = svg.selectAll("circle")
    .data(data)
    .enter()
    .append("circle")
    .attr("r",function(d) { return d; })
    .attr("transform","translate(80,80)")
    .attr("fill","none")
    .style("stroke-width","1")
    .style("stroke",function(d) { return scale(d) });  

  function transition() {
    // Update data, max d is 60:
    data = data.map(function(d) { return d == 60 ? 0 : d + 10});

    var i = 0;
    // Grow circles
    circles
       .data(data)
       .filter(function(d) { return d > 0 })
       .transition()
       //.ease(d3.easeLinear)
       .ease("linear")//set the ease here
       .attr("r", function(d) { return d; })
       .style("stroke", function(d) { return scale(d) })
       .style("opacity",function(d) { return d == 60 ? 0 : 1 })
       .duration(1000)
       //.on("end",function(){if(++i==circles.size()-1) { transition(); } });
        .each("end", function (d,i) {
          //.on("end", function (d,i) {
           if(++i==circles.size()-1) { transition(); }
        });

    // Reset circles where r == 0
    circles
      .filter(function(d) { return d == 0 })
      .attr("r", 0)
      .style("opacity",1)
      .style("stroke",function(d) { return scale(d); });

  }
  transition()
 

從上面的代碼可以看出,原提問者使用來創造出圓環漸進擴散的效果是利用其data變數裡面陣列資料來控制的,並沒有真正使用到d3.transition的觀念。

下面則是裡用transition life cycle來產生圓環漸進擴散的代碼(這邊是d3.v5版本)。

transition life cycle中主要有三種狀態:start, interrupt, end,在下面的代碼中用transition.on可以指定監聽的狀態,在效果transition完後,將此物件的property改回到原始狀態,如此可以完成一個循環

  const svg = d3.select(DOM.svg(250,250));
  const data = Array.from(Array(CircleNumber).keys());

  function emananting(num){

           svg.selectAll('circle.emanting')
               .each((d,i,g)=>{

                let index = i;
                let number = num;

                d3.select(g[i])
                  .transition()
    		  .duration((d,i)=>{
                     return 5000;
                   })
                  .delay((d,i)=>{
                     return index*1000;
                    })
    		  .attr('opacity',0)
    		  .attr('r',50)
                  .on('end', (d,i,g)=>{

                  d3.select(g[i])
.attr('r',10)
.attr('opacity',1);

                  });
                  // control flow from here
                  if (number { return 'number' + i;})
				.attr('r',10)
				.attr('stroke','orange')
     		    .attr('fill','none')
      		    .attr('opacity',1)
     		   	.attr('cx',125)
				.attr('cy',125);
  //control flow here
  let num = 0;
  emananting(num);


參考閱讀:
https://beta.observablehq.com/@weitinglin/demo-how-can-i-make-the-animation-of-a-circle-continous-with-h