這本書The Visual Display of Quantitative Information是耶魯大學統計學家艾德華。塔夫特(Edward Tufte)的經典著作,談論視覺化如何呈現量化資訊(就是資料視覺化),他被稱作現代視覺化大師,整本書很樸素簡單,提供非常大量的精美圖片,來呈現資訊視覺化的方方面面概念,書的寫作邏輯有點特別,需要稍微適應一下。
本書主要分成兩大部分:
1. Graphical Practice
– Graphical Excellence
– Graphical Integrity
– Souces of Graphical Integrity and Sophistication
2. Thoery of Data Graphics
– Data-Ink and Graphical Redesign
– Chartjunk: Vibrations, Grids, and Ducks
– Multifunctioning Graphical Design
– High-Resolution Data Graphics
– Aesthetics and Technique in Data Graphical Design
什麼是好的視覺化(Graphical Excellence)
好的視覺圖表可以展現複雜的想法,將其表達的清楚(clarity)、精準(precision)和有效(efficiency):
1. 呈現資料(show data)
2. 讓觀看者去思考圖表呈現的概念,而非背後的方法
3. 利用有限的空間呈現量化數字
4. 鼓勵用視覺去比較資料
5. 展現資料在不同層次上的細節,從概觀到細部樣貌
6. 具有明確的目的:描述、探索、格式化、裝飾
7. 可以用來結合統計和資料描述
Principles of Graphical Excellence
這張的最後,用什麼定義一個良好的視覺化作結,關鍵就是視覺化的效果能表達清楚資料背後的想法。
Graphical excellence is the well-designed presentation of interesting data-a matter of substance, of statistics, and of design.
Graphical excellence consists of complex ideas communicated with clarity, precision, and efficiency.
Graphical excellence is that which gives to the viewer the greatest number of ideas in the shortest time with the least ink in the smallest space.
Graphical excellence is nearly always multivariate.
And graphical excellence requires telling the truth about the data
視覺化要有誠信Graphical Integrity
這章要談的就是如何讓資料視覺化能“實話實說”,而非玩弄是非。
第一個概念就是:
The number of information-carring dimensions depicted should not exceed the number of dimensions in the data.
這張開頭使用了許多“錯誤”的資料視覺化例子,往往過度華麗資料本身,因此造成視覺化的誤差,這往往就是用了超過資料本身的“維度”來表現資料特性。
第二個概念就是:
Graphics must not quote data out of context, which mean context is essential for graphical integrity.
可以把“要跟誰比”這個想法放在心上,讓資料有足夠的對照組,提供更好的脈絡。
The representation of numbers, as physically measured on the surface of the graphic itself, should be directly proportional to the numerical quantities represented.
Clear, detailed, and thorough labeling should be used to defeat graphical distortion and ambiguity. Write out explanations of the data on the graphic itself. Label important events in the data.
Show data variation, not design variation. #這句講得超好,很容易犯的錯誤
The number of information-carrying dimensions depicted should not exceed the number of dimensions in the data.
Graphics must not quote data out of context.
Data-Ink and Graphical Redesign
Occasionally artfulness of design makes a graphic worthy of the Museum of Modern Art, but essentially statistical graphics are instruments to help people reason about quantitative information
這章開始直指資料視覺化的想法,一開始提到William Playfair這位200多年前的蘇格蘭工程師,所繪製的圖表,左邊是其在1785年,右邊是相隔一年後的風格改進,會發現這樣的改善,很大程度提升直觀性,原因在於其減少了跟資料無關的素材,這邊作者提出的一個核心原則


Above all else show the data.
一張圖表中,決大部分的"墨水"要跟想呈現的資料相關聯,就是所謂的Data-Ink(non-erasable core of a graphic, the non-redundant ink arranged in response to variation in the numbers represented)。
Data-ink ratio = data-ink / total ink used to print the graphic
這邊作者提出一個公式:Data-ink ratio,用來評估一張圖表是否切合這邊提出的原則,盡量減少非資料相關的"墨水",最大化Data-ink ratio。
除了最大化Data-ink的比例,再來則是去除非Data-ink的部分,下面這張圖表做了很好的示範
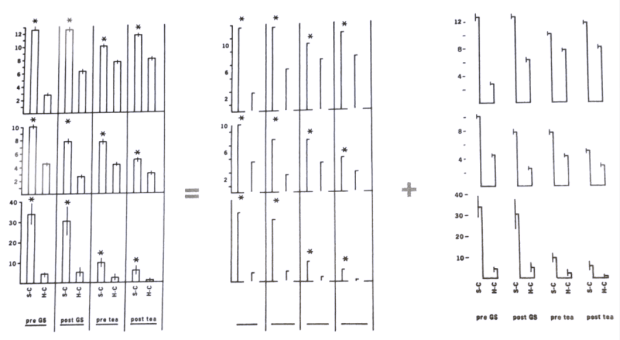
左邊是原始的圖表,而右邊則是non-data ink + data ink的分圖,會發現最右邊只剩下data-ink的圖表,相對於原始圖表更加的清晰明白。
Erase non-data-ink and erase redundant data-ink.
去除圖表中的三個常見多餘:Moiré vibration, Grid 和 Duck

曾經有段時間蠻流行有上面這種填充方式來呈現黑白圖表中的不同資訊,這類黑白型態所形塑的分塊,作者用moire vibration來暱稱,直指是擾亂視聽,沒有太多用處的裝飾。

另外一個就是把隔線(Grid)簡化,藉由合併去除,或是用淡色來取代,可以很大程度提高簡潔感。


延伸閱讀:
史上最傑出的繪圖大師
讀後總結:The Visual Display of Quantitative Information
知乎討論串
豆瓣書單

在〈書籍閱讀:The Visual Display of Quantitative Information〉中有 1 則留言